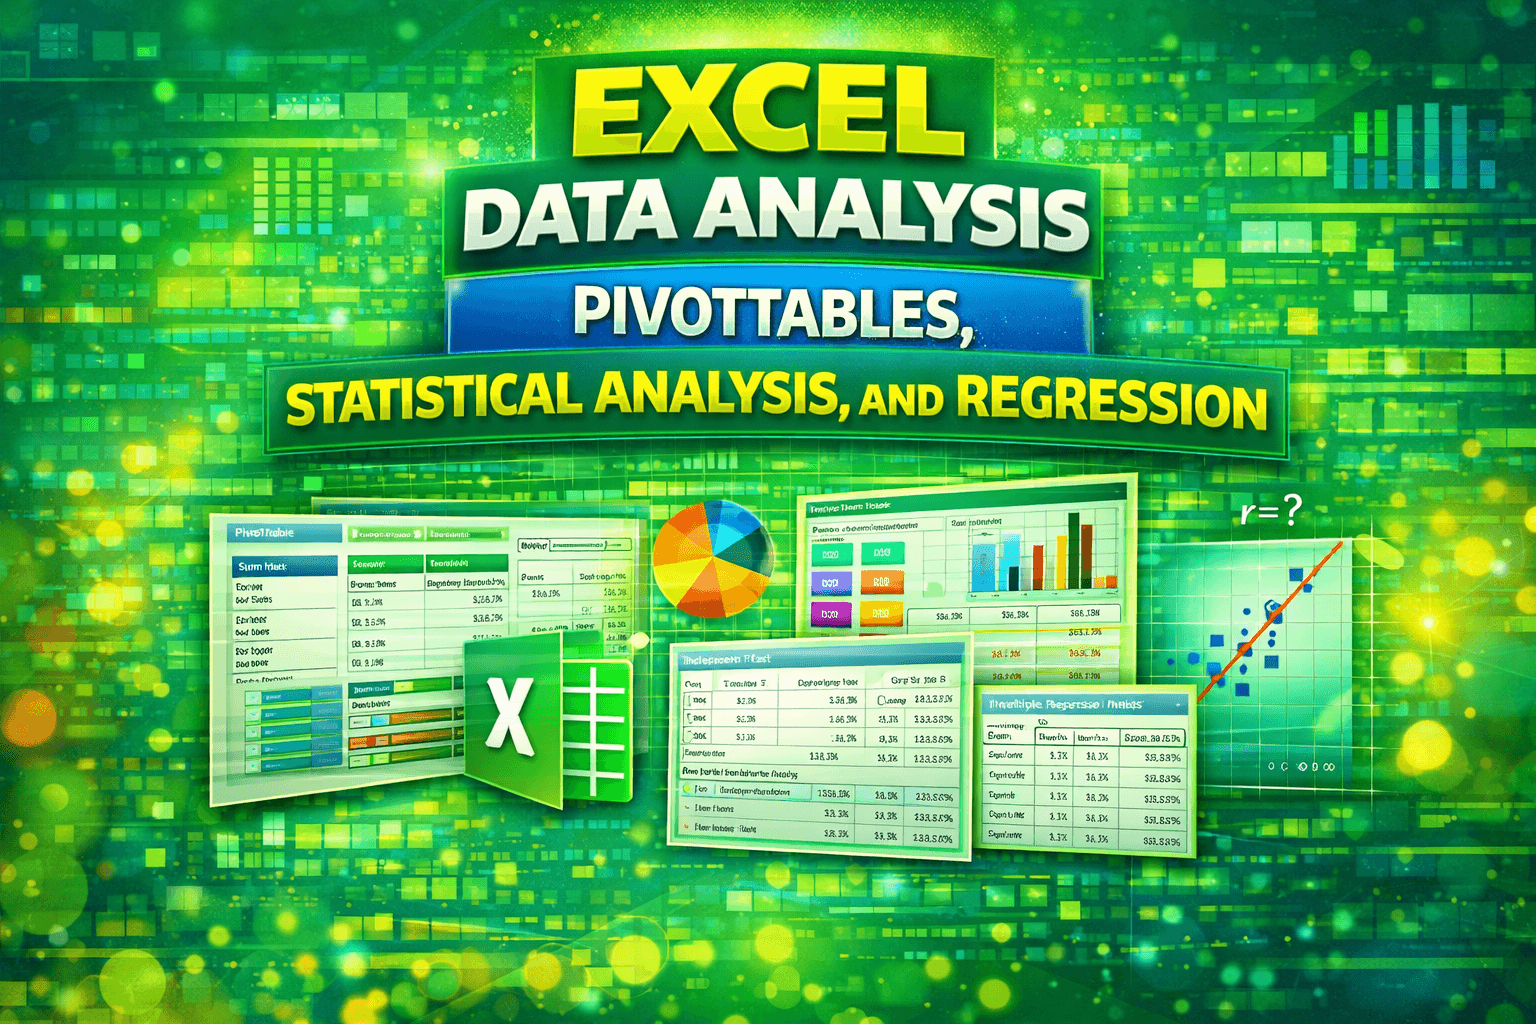
Excel Data Analysis: PivotTables, Statistical Analysis, and Regression
About Course
Learn how to perform advanced data analysis in Excel using PivotTables and statistical techniques to uncover meaningful insights and support data-driven decisions.
This course is designed to take you beyond basic Excel and into the world of analytical thinking and statistical interpretation. You will learn how to summarize large datasets using PivotTables, perform cross-tab analysis, and build interactive dashboards using PivotCharts and slicers.
In addition, you will gain a strong foundation in statistical analysis, including descriptive statistics, hypothesis testing, correlation, and regression. These are the exact techniques used in real-world data analysis, research, and business decision-making.
By the end of this course, you will be able to analyze data scientifically, interpret relationships, and present insights with confidence, making you highly valuable for roles such as data analyst, business analyst, financial analyst, and research analyst.
Course Content
PivotTables and Interactive Analysis
-
Datasets for excel practices
-
PivotTables for GROUP data analysis
09:17 -
PivotTables for CROSSTAB analysis
05:07 -
PivotCharts and Slicers for interactivity
06:42
Statistical Analysis using Excel
Earn a certificate of your expertise!
Add this certificate to your resume to demonstrate your skills & increase your chances of getting noticed.